The Spreadsheet Strikes Back: Baseball’s 2026 Mathematical Reckoning
After the chaos of 2025, the spreadsheets are back for blood. From the Dodgers’ $407M hedge fund to the Brewers’ regression, the 2026 MLB models have spoken.
The scouts still talk about "the look" of a player, but in 2026, the only look that matters is the one reflected in the cold, blue glow of a terminal running FanGraphs’ Monte Carlo simulations. If you want to understand the current state of Major League Baseball, you have to stop looking at the batting cage and start looking at the math. We are living in a bifurcated reality where the Los Angeles Dodgers have effectively solved the puzzle of baseball, while the rest of the league is playing a high-stakes game of musical chairs with a dwindling number of seats.
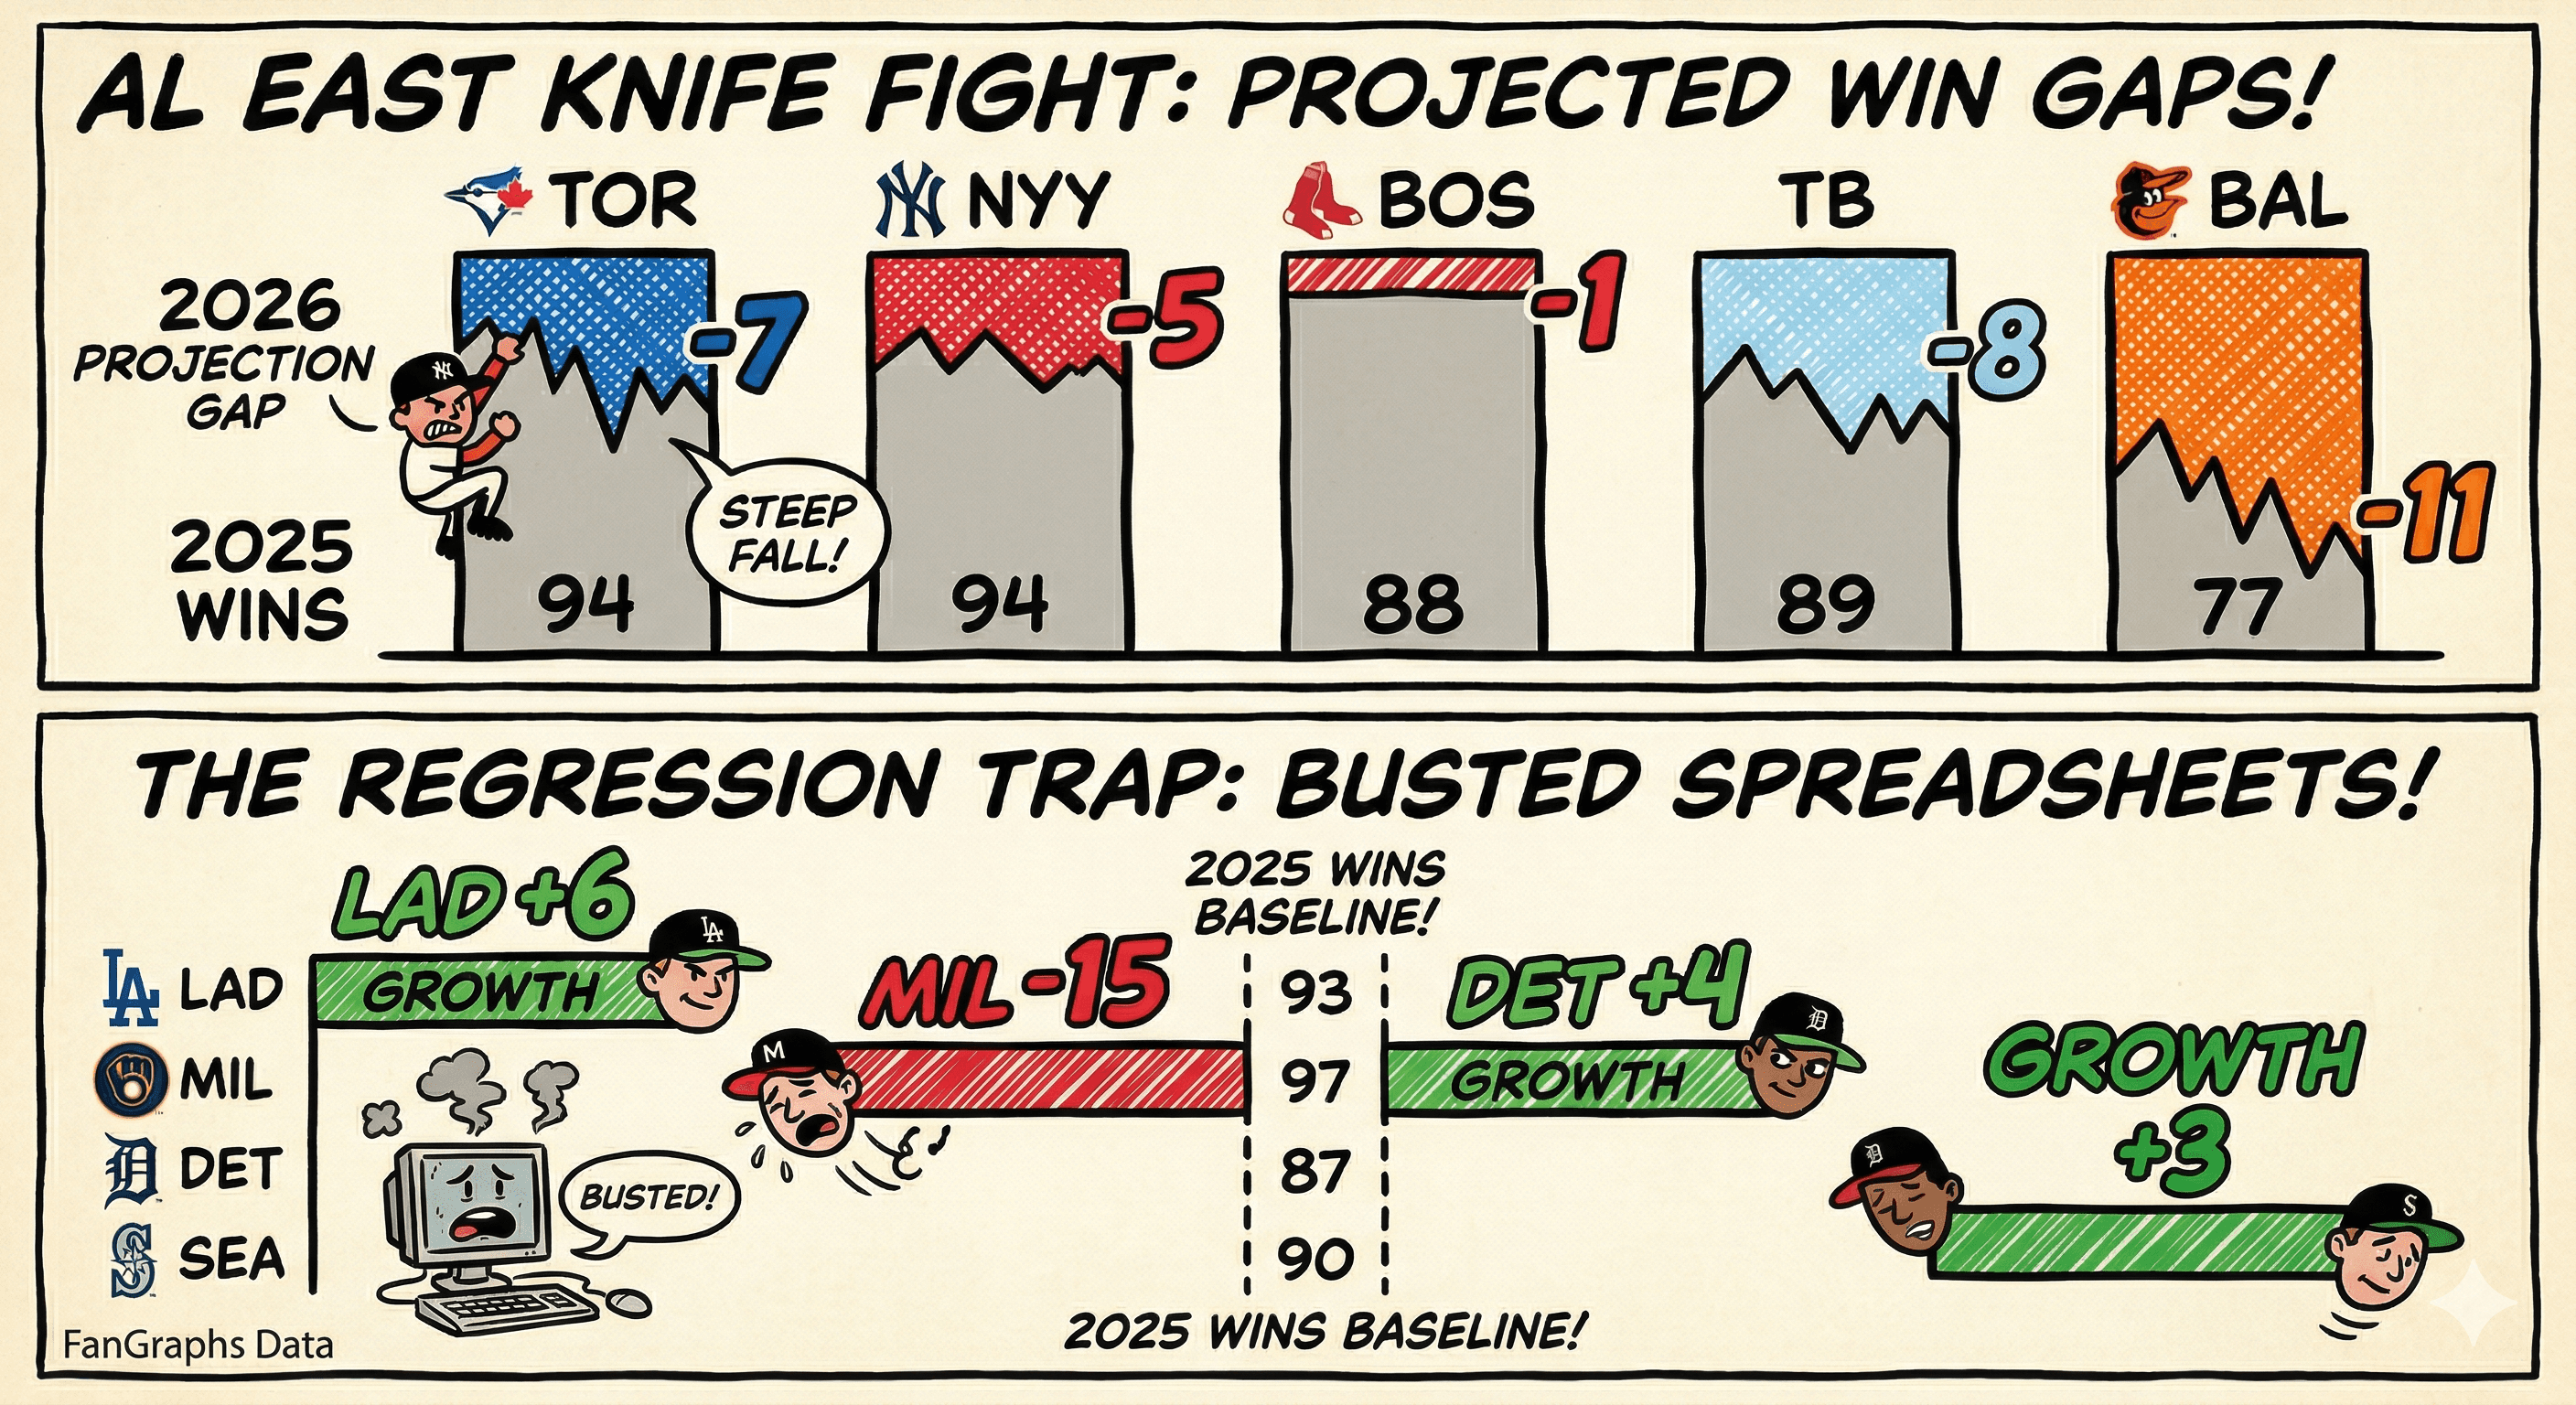
Last year, the 2025 season was a glitch in the Matrix. It was a year where the spreadsheets screamed "regression," and the players screamed back. The Toronto Blue Jays and New York Yankees both dragged themselves to 94 wins through sheer, stubborn force of will. The Milwaukee Brewers, a team the models viewed as a collection of spare parts and pitching lab experiments, defied every peripheral metric to post a staggering 97 wins. It was a beautiful, chaotic middle finger to the projection systems.
But the house always wins eventually. As we sit at the dawn of 2026, the 2.0 version of the "ZIPS" and "Steamer" projections have arrived with a vengeance, and they are here to collect on the debts of 2025.
The Great Blue Inevitability
The Los Angeles Dodgers are no longer a baseball team; they are a $407 million hedge fund that happens to play shortstop. FanGraphs has them projected for 99 wins, but even that feels like a conservative estimate from a cautious accountant. Their Year-to-Date Winning Percentage sits at a perfect 1.000, and while the sample size is microscopic, the underlying Run Differential of +68 is a terrifying omen.
The models project them to finish with a Run Differential of +90. To put that in perspective, the next closest team in the National League, the New York Mets, is projected at +72. The Dodgers are operating with a Projected Full Season RA/G (Runs Allowed per Game) of 4.21. They are essentially a vacuum cleaner designed to suck the hope out of a divisional race before the All-Star break. With a playoff probability of 99.0%, the only thing the models can’t account for is a literal act of God.
The Regression of the "Cinderella" Class
If you are a fan of the Milwaukee Brewers, the 2026 projections feel like a personal insult. After winning 97 games in 2025, the computers have looked at their roster and decided it was all a dream. The 2026 Projected Full Season for Milwaukee sits at 82 wins. That is a 15-game erasure of history. The math suggests that their 2025 success was built on a foundation of high-leverage luck and a bullpen that performed significantly above its expected FIP (Fielding Independent Pitching).
The Toronto Blue Jays find themselves in a similar purgatory. Despite an AL Pennant and 94 wins last year, FanGraphs has them pegged for 87 wins in 2026. The AL East has transformed into a mathematical nightmare where four teams are projected to finish within three games of each other. The New York Yankees are the slight favorites at 89 wins, backed by an elite Projected RS/G (Runs Scored per Game) of 4.78. The models are betting that the Yankees' power metrics are more sustainable than Toronto’s "lightning in a bottle" run from a year ago.
The Rise of the New Efficiency
While the giants fight at the top, the Detroit Tigers have quietly become the darling of the analytical community. Last year, their 87 wins felt like a surprise. This year, the math says it was a baseline. FanGraphs projects them for 86 wins and a +30 Run Differential. In an AL Central division where the White Sox are projected for a dismal 70 wins and a -117 Run Differential, the Tigers are the only team with the statistical profile of a true contender.
Out West, the Seattle Mariners are finally moving past the "potential" phase. They are projected to finish with 87 wins, holding a razor-thin lead over the Houston Astros (79 wins) and the Texas Rangers (81 wins). The Mariners' success is built on a projected RA/G of 4.15, the best in the American League. They are the antithesis of the Dodgers, where LA wins with overwhelming financial force, Seattle wins with run prevention and surgical efficiency.
The Basement of Despair
We cannot talk about the 2026 landscape without looking at the bottom of the spreadsheet, where the numbers turn from cold to cruel. The Colorado Rockies are projected for a 63- 99 season. Their Run Differential is a staggering -188. The math suggests that playing in Coors Field in 2026 will be a form of professional malpractice, as they are projected to allow 5.61 runs per game.
The gap between the top and the bottom has never been wider. The Dodgers are projected to win 36 more games than the Rockies. In a game defined by "any given Sunday" logic, the 162-game season has become a slow, methodical sorting process where the teams with the best algorithms eventually rise to the top.
The 2026 season will likely be remembered as the year the models fought back. After the chaos of 2025, the spreadsheets have reasserted their dominance. But as every gambler knows, the most interesting part of the math is the 1% chance that everything goes wrong.